What is Position Vs Time Graph – Definition, Example Diagrams – Etutor
Etutor Guru
12 Sep 2023
- position time graph
- position time graph for uniform motion
- position time graph for uniformly accelerated motion
- position-time
- what is position time graph
Slope Of Position Vs Time Graph
Position with respect to time is a graph that shows how an object moves over time. The slope of the position vs. time graph indicates the object’s speed at a particular time.
Overview : Position Vs Time Graph
A position vs. time graph shows how fast something is moving by how steep its slope is. So, the slope shows how fast an object is moving at a certain point in time. Don’t forget that speed is a vector number. It means it is big and going somewhere. Another word for how fast something is going is “speed.” Since only straight-line movement is involved, there are only two directions to deal with: forward and backward. If the velocity is greater than zero, the object is moving forward. Objects move in the opposite direction if the speed is negative.
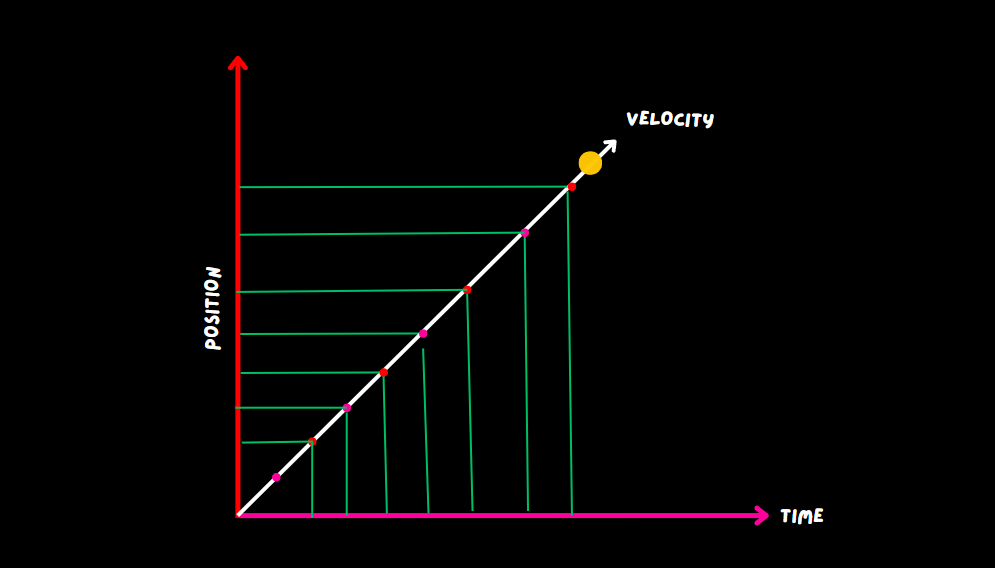
Reading Position vs Time Graph
When graphs are made in the XY plane, the independent variable is usually on the horizontal axis and the dependent variable is on the vertical axis.
In a Position-Time graph, time is the independent variable, and the movement of the object is the dependent variable, which depends on time. The vertical axis shows where the object is, and the horizontal axis shows how long it has been there.

So, the slope of a Position vs. Time graph shows how the position has changed over time, which is also called velocity. So, the slope of a graph of position versus time shows how fast something is moving.
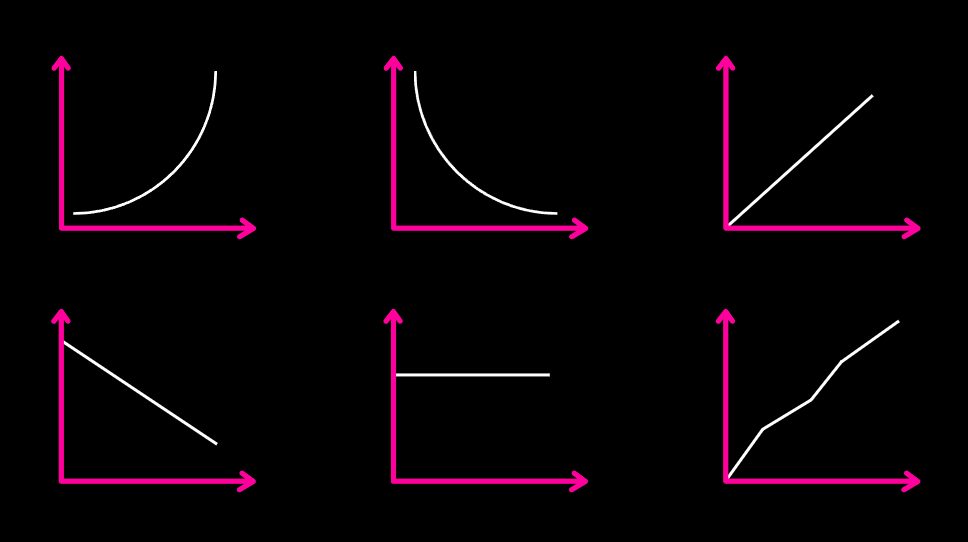
Interpretation of Position vs Time Graph based on the slope
- Zero Slope: If a graph of an object’s position over time is made while it is at rest, it will be a horizontal line.

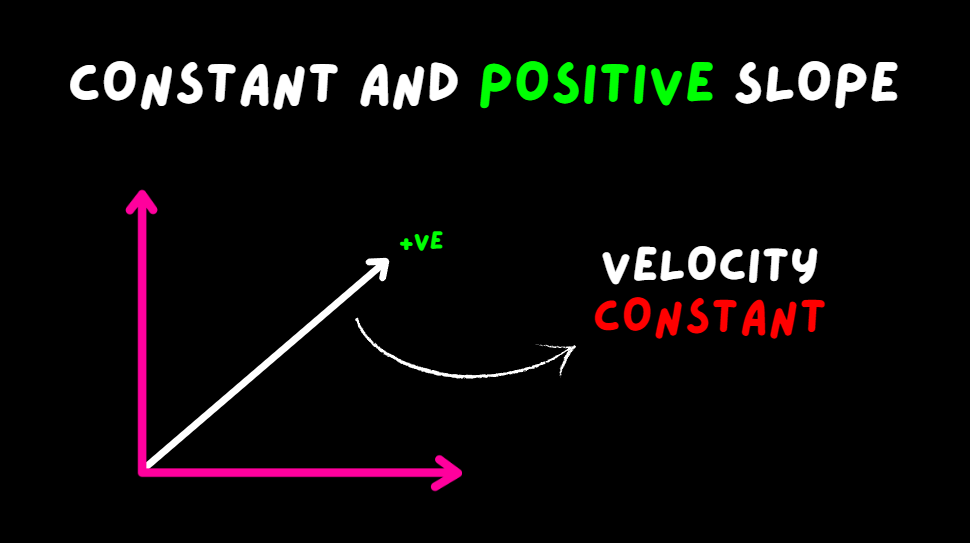
- Constant and Positive Slope: If an object moves forward at the same rate over time, its graph will look like a straight line with a positive slope. It means that the object is moving at the same speed in the same direction. The slope of a straight-line position graph shows how fast an object is moving on average.
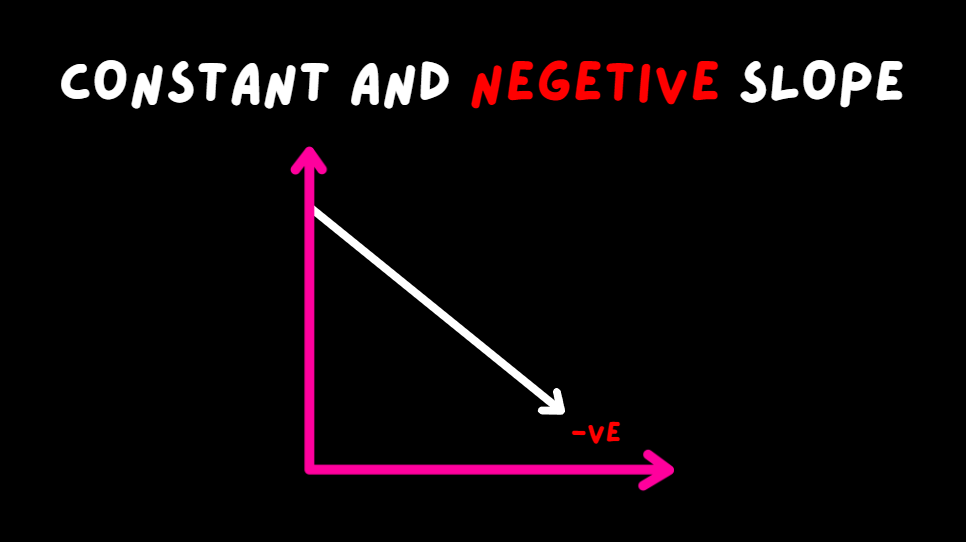
- Constant and Negative Slope: A graph of Position vs. Time for an object moving backwards at the same speed but in the opposite direction will show a straight line with a negative slope. It means that the speed of the object is staying the same and the object is moving backwards. A straight-line graph of position shows how fast an object is moving on average by how steep the slope is.
- Varying and Positive Slope: Both graphs show that the object is speeding up because the line curves and goes up. Since the slope changes at each point, this means that speed changes over time, which is called acceleration.
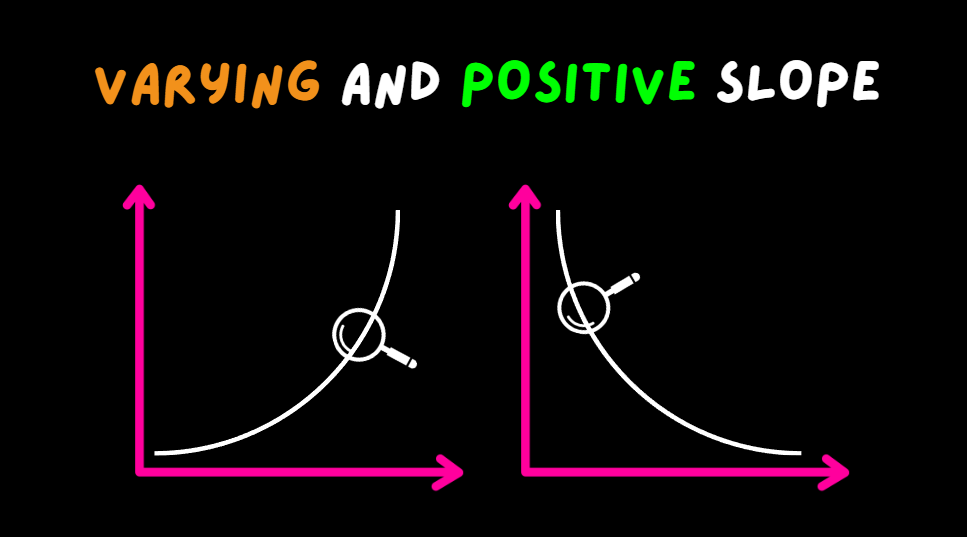
In this situation, the slope of the line drawn from any point on the curve to the curve gives the speed of the object at any given time.
So, it’s clear that the shape of the line on the position-time graph shows different things about how the object is moving (straight, curved, steeply sloped, gently sloped, etc.).